06 / Paris-Dauphine · 2025
Monte Carlo methods for difficult quantiles
Sampling algorithms made inspectable through code, variance comparisons and animation.
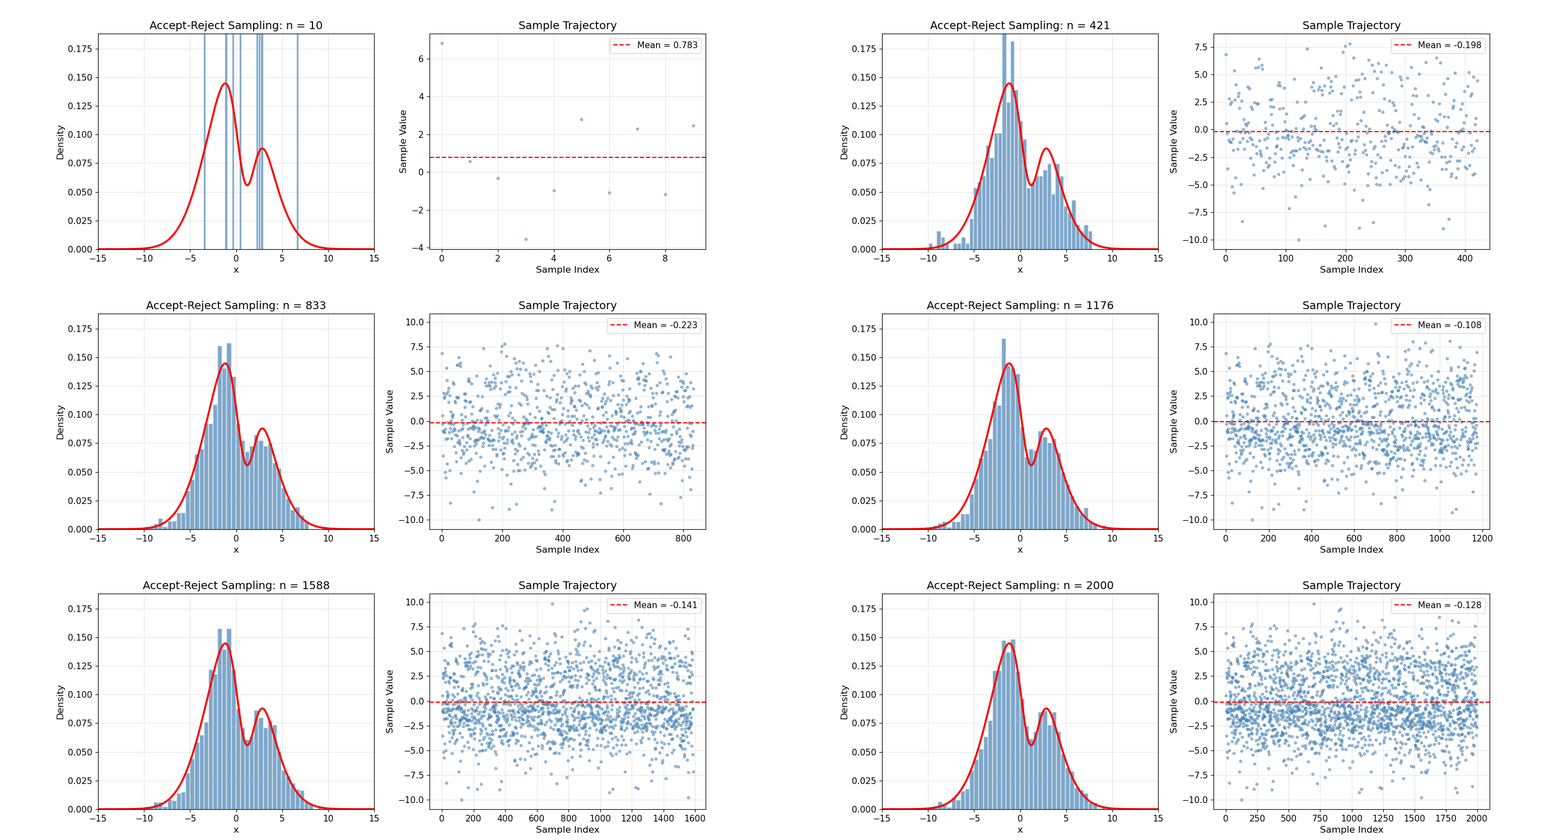
The project turns a probability course assignment into a small reusable simulation package. Animations expose how each sampler behaves, while method comparisons focus on when variance reduction is actually useful.
Evidence register
5
methods
Sampling and variance-reduction strategies
7/7
tests
Passing in a clean Python 3.11 environment
0.95+
tail focus
Importance sampling use case
01 / Problem
Tail probabilities and implicit quantiles can be difficult to estimate efficiently when direct integration or naïve sampling is too costly.
02 / Approach
The code implements multiple samplers behind small modules, then compares convergence and variance while generating visual explanations from the same algorithms.
03 / Outcome
A compact educational package connects mathematical derivation, executable code, static figures and generated animations without depending on a single notebook.
System trace
How the evidence is produced.
Implemented the sampling and variance-reduction methods, numerical comparisons and animation pipeline.
- 01Target density → normalization and reference CDF
- 02Sampler modules → generated observations
- 03Estimator layer → probability and quantile
- 04Diagnostics → figures and animations
Validation scope
Seven numerical unit tests pass in a clean Python 3.11 environment. The complete experiment also runs end to end and reproduces density, sampling, interval and estimator-comparison figures.
Known limitation
The current comparison is educational rather than a large benchmark. Runtime, effective sample size and confidence-interval coverage need systematic reporting.
What is inspectable
- Algorithm modules are separated from notebooks and visual generation.
- The visual assets are produced by the same source code used in the estimates.
- The project includes an MIT license and a concise execution path.
Next proof to add
- 01Extend deterministic coverage to stratification and control-variate edge cases.
- 02Report variance, effective sample size and interval coverage in one benchmark table.
- 03Expose benchmark and CI status directly in this case study.
Main stack